Visualization
視覚化
- Function draw_geometries
draw_geometries関数 - Save view point 視点の記憶
- Rendering styles レンダリング・スタイル
- Geometry primitives 基本的な幾何物体
- Draw_multiple_geometries 複数のジオメトリの描画
- Draw line set 線集合の描画
- Draw textured mesh テクスチャのあるメッシュの描画
注意: コードを走らせる環境に注意すること。TestDataディレクトリがカレント(作業)ディレクトリからみて、祖先ディレクトリの下にあることを確認しよう
# examples/Python/Basic/visualization.py

import numpy as np
import open3d as o3d

if __name__ == "__main__":
    # (1)Function draw_geometries
    print("Load a ply point cloud, print it, and render it")
    pcd = o3d.io.read_point_cloud("../../TestData/fragment.ply")
    o3d.visualization.draw_geometries([pcd])
    # (2)Geometry primitives
    print("Let's draw some primitives")
    mesh_box = o3d.geometry.TriangleMesh.create_box(width=1.0,
                                                    height=1.0,
                                                    depth=1.0)
    mesh_box.compute_vertex_normals()
    mesh_box.paint_uniform_color([0.9, 0.1, 0.1])
    mesh_sphere = o3d.geometry.TriangleMesh.create_sphere(radius=1.0)
    mesh_sphere.compute_vertex_normals()
    mesh_sphere.paint_uniform_color([0.1, 0.1, 0.7])
    mesh_cylinder = o3d.geometry.TriangleMesh.create_cylinder(radius=0.3,
                                                              height=4.0)
    mesh_cylinder.compute_vertex_normals()
    mesh_cylinder.paint_uniform_color([0.1, 0.9, 0.1])
    mesh_frame = o3d.geometry.TriangleMesh.create_coordinate_frame(
        size=0.6, origin=[-2, -2, -2])
    # (3)Draw multiple geometries
    print("We draw a few primitives using collection.")
    o3d.visualization.draw_geometries(
        [mesh_box, mesh_sphere, mesh_cylinder, mesh_frame])

    print("We draw a few primitives using + operator of mesh.")
    o3d.visualization.draw_geometries(
        [mesh_box + mesh_sphere + mesh_cylinder + mesh_frame])
    # (4)Draw line set
    print("Let's draw a cubic using o3d.geometry.LineSet.")
    points = [
        [0, 0, 0],
        [1, 0, 0],
        [0, 1, 0],
        [1, 1, 0],
        [0, 0, 1],
        [1, 0, 1],
        [0, 1, 1],
        [1, 1, 1],
    ]
    lines = [
        [0, 1],
        [0, 2],
        [1, 3],
        [2, 3],
        [4, 5],
        [4, 6],
        [5, 7],
        [6, 7],
        [0, 4],
        [1, 5],
        [2, 6],
        [3, 7],
    ]
    colors = [[1, 0, 0] for i in range(len(lines))]
    line_set = o3d.geometry.LineSet(
        points=o3d.utility.Vector3dVector(points),
        lines=o3d.utility.Vector2iVector(lines),
    )
    line_set.colors = o3d.utility.Vector3dVector(colors)
    o3d.visualization.draw_geometries([line_set])
    # (5) Draw a textured triangle mesh from obj file
    print("Let's draw a textured triangle mesh from obj file.")
    textured_mesh = o3d.io.read_triangle_mesh("../../TestData/crate/crate.obj")
    textured_mesh.compute_vertex_normals()
    o3d.visualization.draw_geometries([textured_mesh])
    # (1)Function draw_geometries
    print("Load a ply point cloud, print it, and render it")
    pcd = o3d.io.read_point_cloud("../../TestData/fragment.ply")
    o3d.visualization.draw_geometries([pcd])
Open3Dには、ジオメトリオブジェクト(PointCloud、TriangleMesh、Image)のリストを取得し、レンダリングする便利な可視化のための関数draw_geometriesが用意されている。 可視化では、マウス操作、回転スタイルの変更、スクリーンキャプチャによる回転、平行移動、スケーリングなどの多くの機能を実装している。 ウィンドウ内のhを押すと、機能の包括的なリストが印刷される。
-- Mouse view control --
  Left button + drag        : Rotate.
  Ctrl + left button + drag : Translate.
  Wheel                     : Zoom in/out.

-- Keyboard view control --
  [/]          : Increase/decrease field of view.
  R            : Reset view point.
  Ctrl/Cmd + C : Copy current view status into the clipboard.
  Ctrl/Cmd + V : Paste view status from clipboard.

-- General control --
  Q, Esc       : Exit window.
  H            : Print help message.
  P, PrtScn    : Take a screen capture.
  D            : Take a depth capture.
  O            : Take a capture of current rendering settings.
注:
一部のオペレーティングシステム(OS Xなど)では、視覚化ウィンドウがキーボード入力に応答しない場合がある。普通これは、コンソールが入力フォーカスを視覚化ウィンドウに渡さずに保持するために起こる。python Visualization.pyの代わりにpythonw Visualization.pyを呼使えば、この問題は解決する。
注:
draw_geometriesに加えて、Open3Dには高度な機能を持つ類似関数のセットがある。draw_geometries_with_custom_animationを使用すると、プログラマはカスタムビュー軌道を定義し、GUIでアニメーションを再生することができる。 draw_geometries_with_animation_callbackおよびdraw_geometries_with_key_callbackは、Pythonコールバック関数を入力として受け入れる。 コールバック関数は、自動アニメーションループまたはキープレスイベントで呼び出される。 詳細については、カスタマイズされた可視化を参照のこと。
Save view point
最初、点群は上下逆さまにレンダリングされる:

マウスの左ボタン+ドラッグで視点を調整した後、より良い視点に達することができる:

この視点を保持するには、ctrl cを押す。 視点はクリップボードに保存されたjson文字列に変換される。 カメラを別のビューに移動すると、次のようになる。

ctrl vを押すと元の表示に戻る。
Rendering styles
Open3D visualizerはいくつかのレンダリング・スタイルをサポートしている。 たとえば、l を押すと、Phongの照明と単純なカラー・レンダリングが切り替わり、 2を押すと、x座標に基づいて着色された点が表示される。

カラーマップは、shift 4を押すなどして調整することもできる。 これにより、ジェットカラーマップがホットカラーマップに変更される。

Geometry primitives
examples/Python/Basic/visualization.py の2番目の部分コード:
# (2)Geometry primitives
print("Let's draw some primitives")
mesh_box = o3d.geometry.TriangleMesh.create_box(width=1.0,
                                                height=1.0,
                                                depth=1.0)
mesh_box.compute_vertex_normals()
mesh_box.paint_uniform_color([0.9, 0.1, 0.1])
mesh_sphere = o3d.geometry.TriangleMesh.create_sphere(radius=1.0)
mesh_sphere.compute_vertex_normals()
mesh_sphere.paint_uniform_color([0.1, 0.1, 0.7])
mesh_cylinder = o3d.geometry.TriangleMesh.create_cylinder(radius=0.3,
                                                          height=4.0)
mesh_cylinder.compute_vertex_normals()
mesh_cylinder.paint_uniform_color([0.1, 0.9, 0.1])
mesh_frame = o3d.geometry.TriangleMesh.create_coordinate_frame(
size=0.6, origin=[-2, -2, -2])このコードは、create_mesh_sphereおよびcreate_mesh_cylinderを使用して球と円柱を生成する。 球は青で塗られており、シリンダーは緑色で塗装されている。 Phongシェーディングをサポートするために、両方のメッシュに対して法線が計算される(3Dメッシュとサーフェスの法線推定の可視化を参照)。 create_mesh_coordinate_frameを使って原点を(-2、-2、-2)に設定した座標軸を作成することもできる。
Draw multiple geometries
examples/Python/Basic/visualization.py の3番目の部分コード:
    # (3)Draw multiple geometries
    print("We draw a few primitives using collection.")
    o3d.visualization.draw_geometries(
        [mesh_box, mesh_sphere, mesh_cylinder, mesh_frame])

    print("We draw a few primitives using + operator of mesh.")
    o3d.visualization.draw_geometries(
        [mesh_box + mesh_sphere + mesh_cylinder + mesh_frame])
draw_geometriesはジオメトリのリストをとり、すべてを一緒にレンダリングする。 別な方法として、TriangleMeshが+演算子をサポートしていることを用いて、複数のメッシュを1つに結合する。一番目のアプローチを推薦する。なぜなら、異なるジオメトリの組み合わせをサポートするからである(例えば、メッシュを点群と並行してレンダリングする)。

Draw line set
examples/Python/Basic/visualization.py の4番目の部分コード:
    # (4)Draw line set
    print("Let's draw a cubic using o3d.geometry.LineSet.")
    points = [
        [0, 0, 0],
        [1, 0, 0],
        [0, 1, 0],
        [1, 1, 0],
        [0, 0, 1],
        [1, 0, 1],
        [0, 1, 1],
        [1, 1, 1],
    ]
    lines = [
        [0, 1],
        [0, 2],
        [1, 3],
        [2, 3],
        [4, 5],
        [4, 6],
        [5, 7],
        [6, 7],
        [0, 4],
        [1, 5],
        [2, 6],
        [3, 7],
    ]
    colors = [[1, 0, 0] for i in range(len(lines))]
    line_set = o3d.geometry.LineSet(
        points=o3d.utility.Vector3dVector(points),
        lines=o3d.utility.Vector2iVector(lines),
    )
    line_set.colors = o3d.utility.Vector3dVector(colors)
    o3d.visualization.draw_geometries([line_set])
線を描画するには、LineSetを定義し、点の集合とエッジの集合を作る必要がある。 エッジは、ポ点のインデックスのペアである。上記の例は、立方体を作成するために点とエッジ(線で表示)を作成している。色はオプションである。この例では、各エッジに赤色[1,0,0]を割り当てている。 このコードにより、次の立方体が視覚化される。(注: 線が醜いかもしれない)

より鮮明にしたもの: 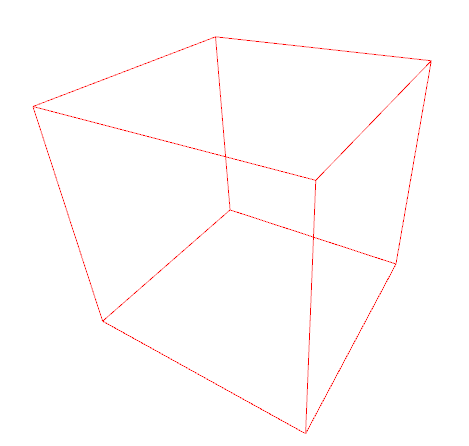
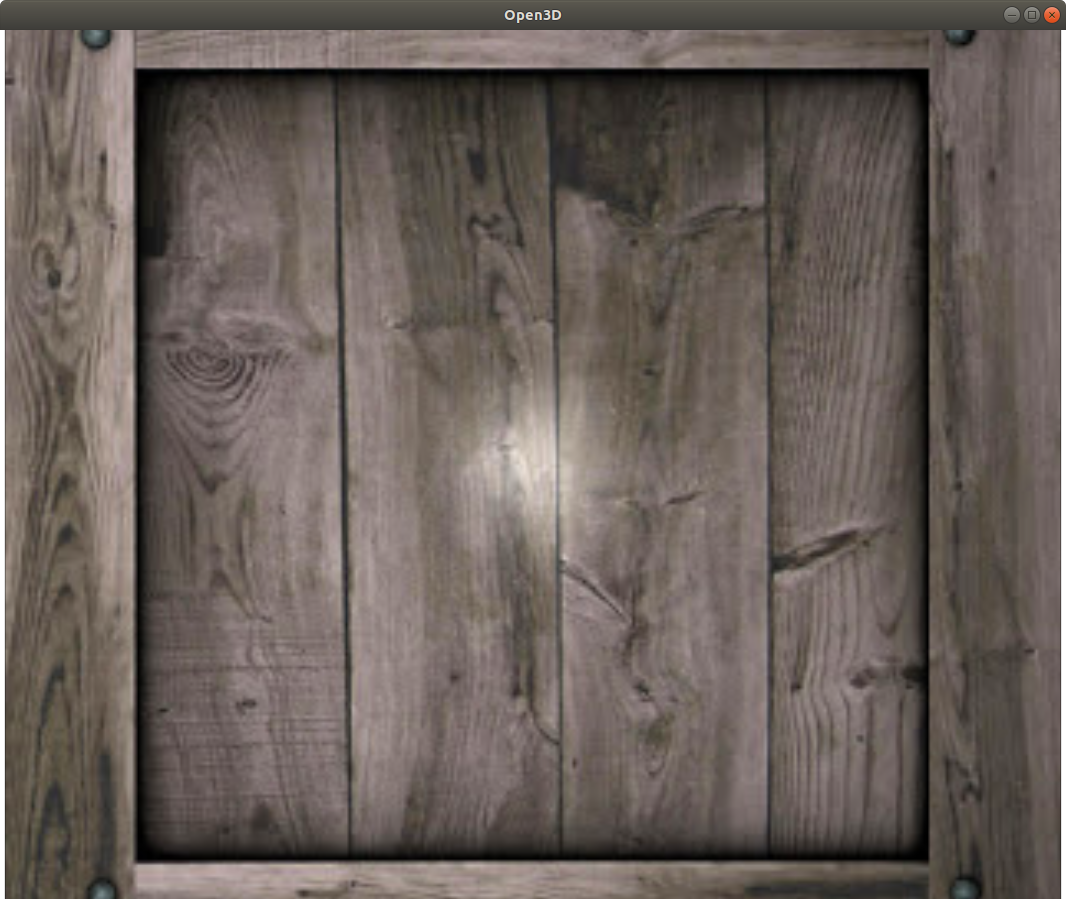
Draw textured mesh
examples/Python/Basic/visualization.py の最後の部分コード:
 Try:
    # (5) Draw a textured triangle mesh from obj file
    print("Let's draw a textured triangle mesh from obj file.")
    textured_mesh = o3d.io.read_triangle_mesh("../../TestData/crate/crate.obj")
    textured_mesh.compute_vertex_normals()
    o3d.visualization.draw_geometries([textured_mesh])
objファイルを読み込み、triangle meshに変換し、法線ベクトルを計算して、draw_geometoriesメソッドで表示している。
表示されるものは: